반응형
SVM(Support Vector Machine)
- 머신러닝에서는 딥러닝이 활발해지기 전까지 제일 많이 활용됨
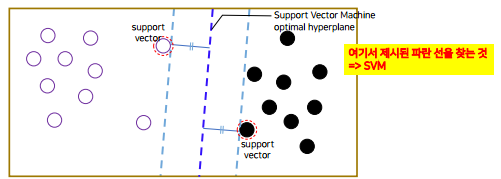
→ 흰색원 , 검은색원을 분류를 할 수 있는 기준을 찾는 것
- logistic regression은 함수의 fitting을 하면서 찾았고 SVM은 각 데이터들 사이에 선을 그을때 마진 (선이랑 가까운 데이터들의 거리) 을 최대한으로 그려주는 선을 찾는다.
SVM 실습
https://scikit-learn.org/stable/modules/generated/sklearn.svm.SVC.html?highlight=svc#sklearn.svm.SVC
→ 파라미터 찾는 사이트
★ tensorflow가 딥러닝에 특화되어 있다면, scikit-learn은 기존의 머신러닝 알고리즘에 사용 가능하고 기초적인 딥러닝까지 가능한 라이브러리임 !
import numpy as np
import matplotlib.pyplot as plt

# scikit learn 알고리즘 - machine learning
from sklearn.datasets.samples_generator import make_blobs
from sklearn.svm import SVC
- 임의의 데이터 생성 → 두개의 센터로 만들어서 50개 데이터를 만들어줌
X, y = make_blobs(n_samples=50, centers=2, random_state=0, cluster_std=0.60)
plt.scatter(X[:,0], X[:, 1], c=y, s=50, cmap='autumn')
- 임의의 데이터를 분류할 수 있는 선 생성
xfit = np.linspace(-1, 3.5)
plt.scatter(X[:,0], X[:,1], c=y, s=50, cmap='autumn')

for m,b in [(1,0.65), (0.5, 1.6), (-0.2, 2.9)]:
  plt.plot(xfit, m*xfit+b, '-k')

plt.xlim(-1, 3.5);
xfit = np.linspace(-1, 3.5)
plt.scatter(X[:,0], X[:,1], c=y, s=50, cmap='autumn')

for m,b in [(1,0.65), (0.5, 1.6), (-0.2, 2.9)]:
  plt.plot(xfit, m*xfit+b, '-k')

plt.xlim(-1, 3.5);

plt.plot([0.6], [2.1], 'x', color='blue', markeredgewidth=2, markersize=10)
plt.plot([3.0], [3.2], 'x', color='blue', markeredgewidth=2, markersize=10)
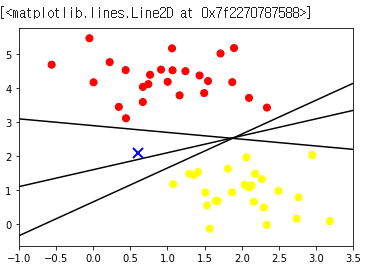
→ 선을 세개로 그을 수 있는데 임의의 데이터(X)가 들어왔을 때, 첫번째 선과 두번째 선이랑 분류결과가 다르게 나올 수 있기때문에 최적의 평균을 찾기 위해서 SVM을 돌린다.
- 모델 선언
- scikit-learn의 SVC 사용
- kernel = 'linear' → 직선
- model.fit( ) 함수를 호출하면 학습이 완료됨
model = SVC(kernel='linear', C=1E10) # Support Vector Classifier
model.fit(X, y)
- 그림 그리기
def plot_svc_decision_function(model, ax=None, plot_support=True):
    """Plot the decision function for a 2D SVC"""
    if ax is None:
        ax = plt.gca()
    xlim = ax.get_xlim()
    ylim = ax.get_ylim()

    # create grid to evaluate model
    x = np.linspace(xlim[0], xlim[1], 30)
    y = np.linspace(ylim[0], ylim[1], 30)
    Y, X = np.meshgrid(y, x)
    xy = np.vstack([X.ravel(), Y.ravel()]).T
    P = model.decision_function(xy).reshape(X.shape)

    # plot decision boundary and margins
    ax.contour(X, Y, P, colors='k',
               levels=[-1, 0, 1], alpha=0.5,
               linestyles=['--', '-', '--'])

    # plot support vectors
    if plot_support:
        ax.scatter(model.support_vectors_[:, 0],
                   model.support_vectors_[:, 1],
                   s=300, linewidth=1, facecolors='none');
    ax.set_xlim(xlim)
    ax.set_ylim(ylim)
plt.scatter(X[:, 0], X[:, 1], c=y, s=50, cmap='autumn')
plot_svc_decision_function(model);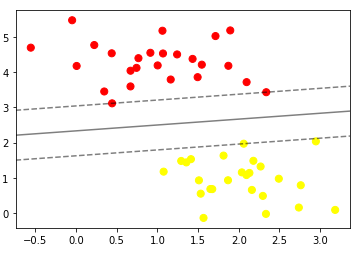
→ SVM을 학습하는 도구가 가장 가까운 데이터들에서 마진을 최대로 잡을 수 있는 선을 찾는다.
plt.scatter(X[:, 0], X[:, 1], c=y, s=50, cmap='autumn')
plt.plot([0.6], [2.1], 'x', color='blue', markeredgewidth=2, markersize=10)
plot_svc_decision_function(model);
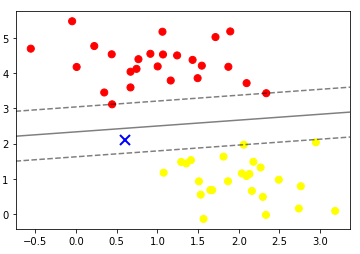
→ 아까 넣었던 임의의 데이터를 넣으면 선을 기준으로 노란색 원들과 더 가깝기 때문에 노란색으로 분류가 된다.
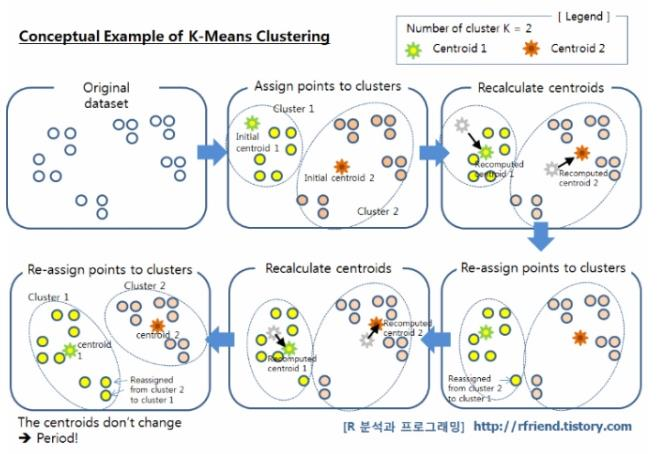
K-means clustering
- 머신러닝에서 비지도 학습의 대표적인 방법
- 위에서 배웠던 Linear, Logistic regression , SVM은 다 X에 따라서 y의 값이 있었고 어떤게 분류인지 이런 값이 있다던지, 선형회귀는 입력값에 대한 y값이 존재했는데 K-means clustering은 label이 없이 진행됨
- Original data 가 아무색도 없어서 몇개로 묶을 것인지 지정이 가능함 (K값 = 2)
- K값을 정하면 점이 K값만큼 생성된다.
- 모든 데이터에서 이 점들이랑 거리를 어떤게 더 가까운지 판별을 하고 가까운거에 대해서 cluster를 묶어준다.
- cluster로 묶어주고 cluster 내에 있는 점들을 활용해서 Centroid - 중심점을 옮겨주고 중심점이 옮겨진 후 한번 더 전체 데이터에 대해서 중심점에 대해서 어떤게 더 가까운지 다시 분류한다 !!!!!!
- 다시 묶은 다음 cluster를 옮기고 다시 또 !! 전체 데이터에서 분류를 한다,,
실사용 예시 )
쇼핑몰에서 티셔츠 사이즈를 사람들의 키와 몸무게에 대한 데이터를 가지고 클러스터를 만든다.
→ 사이즈 추천
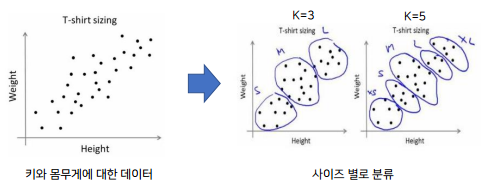
SVM 같은 경우에는 실제로 분류를 해야되는 경우에서 활용이 되는데, K-means clustering 은 분류없이 오리지널 데이터에서 클러스터링을 하고 클러스터를 나눔
K-means clustering 구현
- 주어진 기본 코드를 이용하여 데이터 생성
- K 값은 2 (랜덤한 좌표를 갖는 두 점을 생성)
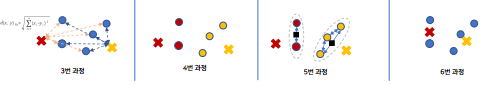
- 수식을 이용하여 모든 데이터와 Ki 값 사이의 거리를 계산
- 데이터가 K1에 가까우면 K1으로 분류, 데이터가 K2에 가까우면 K2로 분류
- 분류된 값들의 x, y 좌표 평균값을 구함
- centroid 업데이트
- 3~6번 (epochs)과정을 여러번 반봅
- 결과 출력

K-means clustering 실습
- Import Libraries
import numpy as np
import matplotlib.pyplot as plt
import random
# Use matplotlib in notebook output
%matplotlib inline
- 데이터 정의
- 먼저 알고리즘을 테스트 할 데이터를 정의합니다. 이 노트북에서 사용하고있는 데이터는 가짜 데이터이지만 이해하기 위해 축구 경기의 선수 통계라고 생각해 봅시다.
# Data - [average passes, average goals (player goals - opponent goals)]
X = [[100,5], [90,5], [110,5], [97,4], [102,4], [112,4], [92,4], [95,3], [90,3], [100,3],
     [110,5], [100,5], [110,4], [93,3], [107,2], [117,3], [96,2], [105,3], [100,3], [110,3],
     [60,-1], [70,-1],[40,1], [70,-3], [50,-1], [80,0],[50,0],[60,-1],[60,1],[55,0],
     [40,-1], [45,-1],[40,0], [55,-3], [60,-1], [65,0],[70,0],[51,-2],[51,1],[48,0]]
- 2D 그래프에 데이터 플로팅
plotx = []
ploty = []
for i in range(len(X)):
    plotx.append(X[i][0])
    ploty.append(X[i][1])
    # print(plotx, ploty)
plt.plot(plotx,ploty, 'bo')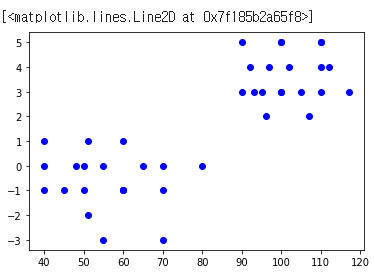
def random_centers(dim,k):
    centers = []
    for i in range(k):
        center = []
        for d in range(dim):
            rand = random.randint(0,100)
            center.append(rand)
        centers.append(center)
    return centers

def point_clustering(data, centers, dims, first_cluster=False):
    for point in data:
        nearest_center = 0
        nearest_center_dist = None
        for i in range(0, len(centers)):
            euclidean_dist = 0
            for d in range(0, dims):
                dist = abs(point[d] - centers[i][d])
                euclidean_dist += dist
            euclidean_dist = np.sqrt(euclidean_dist)
            if nearest_center_dist == None:
                nearest_center_dist = euclidean_dist
                nearest_center = i
            elif nearest_center_dist > euclidean_dist:
                nearest_center_dist = euclidean_dist
                nearest_center = i
        if first_cluster:
            point.append(nearest_center)
        else:
            point[-1] = nearest_center
    return data

def mean_center(data, centers, dims):
    print('centers:', centers, 'dims:', dims)
    new_centers = []
    for i in range(len(centers)):
        new_center = []
        n_of_points = 0
        total_of_points = []
        for point in data:
            if point[-1] == i:
                n_of_points += 1
                for dim in range(0,dims):
                    if dim < len(total_of_points):
                        total_of_points[dim] += point[dim]
                    else:
                        total_of_points.append(point[dim])
        if len(total_of_points) != 0:
            for dim in range(0,dims):
                print(total_of_points, dim)
                new_center.append(total_of_points[dim]/n_of_points)
            new_centers.append(new_center)
        else:
            new_centers.append(centers[i])


    return new_centers
- K- 평균 클러스터링 알고리즘
# Gets data and k, returns a list of center points.
def train_k_means_clustering(data, k=2, epochs=5):
    dims = len(data[0])
    print('data[0]:',data[0])
    centers = random_centers(dims,k)

    clustered_data = point_clustering(data, centers, dims, first_cluster=True)

    for i in range(epochs):
        centers = mean_center(clustered_data, centers, dims)
        clustered_data = point_clustering(data, centers, dims, first_cluster=False)

    return centers

def predict_k_means_clustering(point, centers):
    dims = len(point)
    center_dims = len(centers[0])

    if dims != center_dims:
        raise ValueError('Point given for prediction have', dims, 'dimensions but centers have', center_dims, 'dimensions')

    nearest_center = None
    nearest_dist = None

    for i in range(len(centers)):
        euclidean_dist = 0
        for dim in range(1, dims):
            dist = point[dim] - centers[i][dim]
            euclidean_dist += dist**2
        euclidean_dist = np.sqrt(euclidean_dist)
        if nearest_dist == None:
            nearest_dist = euclidean_dist
            nearest_center = i
        elif nearest_dist > euclidean_dist:
            nearest_dist = euclidean_dist
            nearest_center = i
        print('center:',i, 'dist:',euclidean_dist)

    return nearest_center
centers = train_k_means_clustering(X, k=2, epochs=5)
print(centers)
point = [110,3]
print(predict_k_means_clustering(point, centers))

plt.plot(plotx,ploty, 'bo', centers[0][0], centers[0][1],'ro', centers[1][0], centers[1][1], 'go')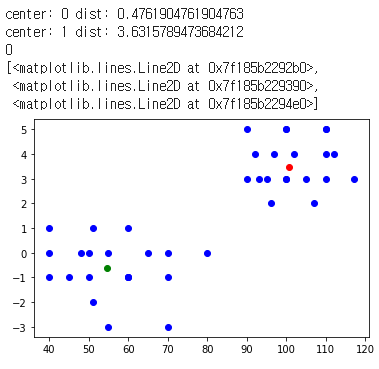
반응형
'AI' 카테고리의 다른 글
| [AI] DNN(Deep Neural Network)이란? - 개념 및 실습 (0) | 2020.12.15 |
|---|---|
| [AI] 딥러닝 개요 - 순전파, 역전파 그리고 활성화 함수 (0) | 2020.12.15 |
| [AI] 딥러닝의 개요 - 퍼셉트론 (2) | 2020.11.27 |
| [AI] 회귀(Regression) 실습 - 선형회귀 및 로지스틱 회귀 (0) | 2020.11.27 |
| [AI] 인공지능의 개요 (0) | 2020.11.27 |